
[Guide: Fetching Large Logs From Loki in Kubernetes]
Analyze with AI
Get AI-powered insights from this Mad Devs tech article:
Before you start
The approach described in this article remains valid. A few additions for high-volume scenarios:
- For very large exports (1M+ log lines), LogCLI now supports parallel querying via
--parallel-durationand--parallel-max-workersflags. These split the time range into chunks and fetch them concurrently, significantly reducing total export time and avoidingmax_entries_limit_per_query errors. - Loki Query Limits Policy entered public preview on Grafana Cloud Logs in early 2026. It introduces automated guardrails that can block or throttle expensive queries before they run – if you're hitting unexpected query denials, check your tenant's limits configuration (
max_query_length,max_entries_limit_per_query,split_queries_by_interval). - If you prefer not to install the LogCLI binary locally, it can be run as a temporary Kubernetes pod in the same namespace as Loki, using the same Loki image version, which avoids version mismatch issues.
Why Grafana UI is not enough to export large Loki logs
In our most recent project, we faced a significant challenge: extracting application logs per day from Loki in a Kubernetes environment. When cold, the application writes about 60 lines per minute, and when someone interacts with the application, it can write 2000-5000 lines of logs per minute. It turned out that we needed to get more than 300,000 lines of logs in total. Our project setup did not include a configured log export, and our primary log viewing tool was Grafana, which imposes a 5000-line limit on log retrieval. Increasing this limit was not feasible as it would have been a significant drain on our resources and was unnecessary for this one-time task. Additionally, accessing logs directly from the Kubernetes pod was not an option due to storage limitations within the pod itself.
So, we need to download logs directly from Loki without changing any configurations.
Preparation
Used tools
Additional steps
To ensure that the query we will use to search for logs is correct, follow these steps:
1. Navigate to Grafana Explore:
Go to Grafana > Explore
2. Set the Required Label:
Apply the necessary label to filter logs by the service.
3. Filter by Date:
Use the operation filter to display lines containing the desired date.
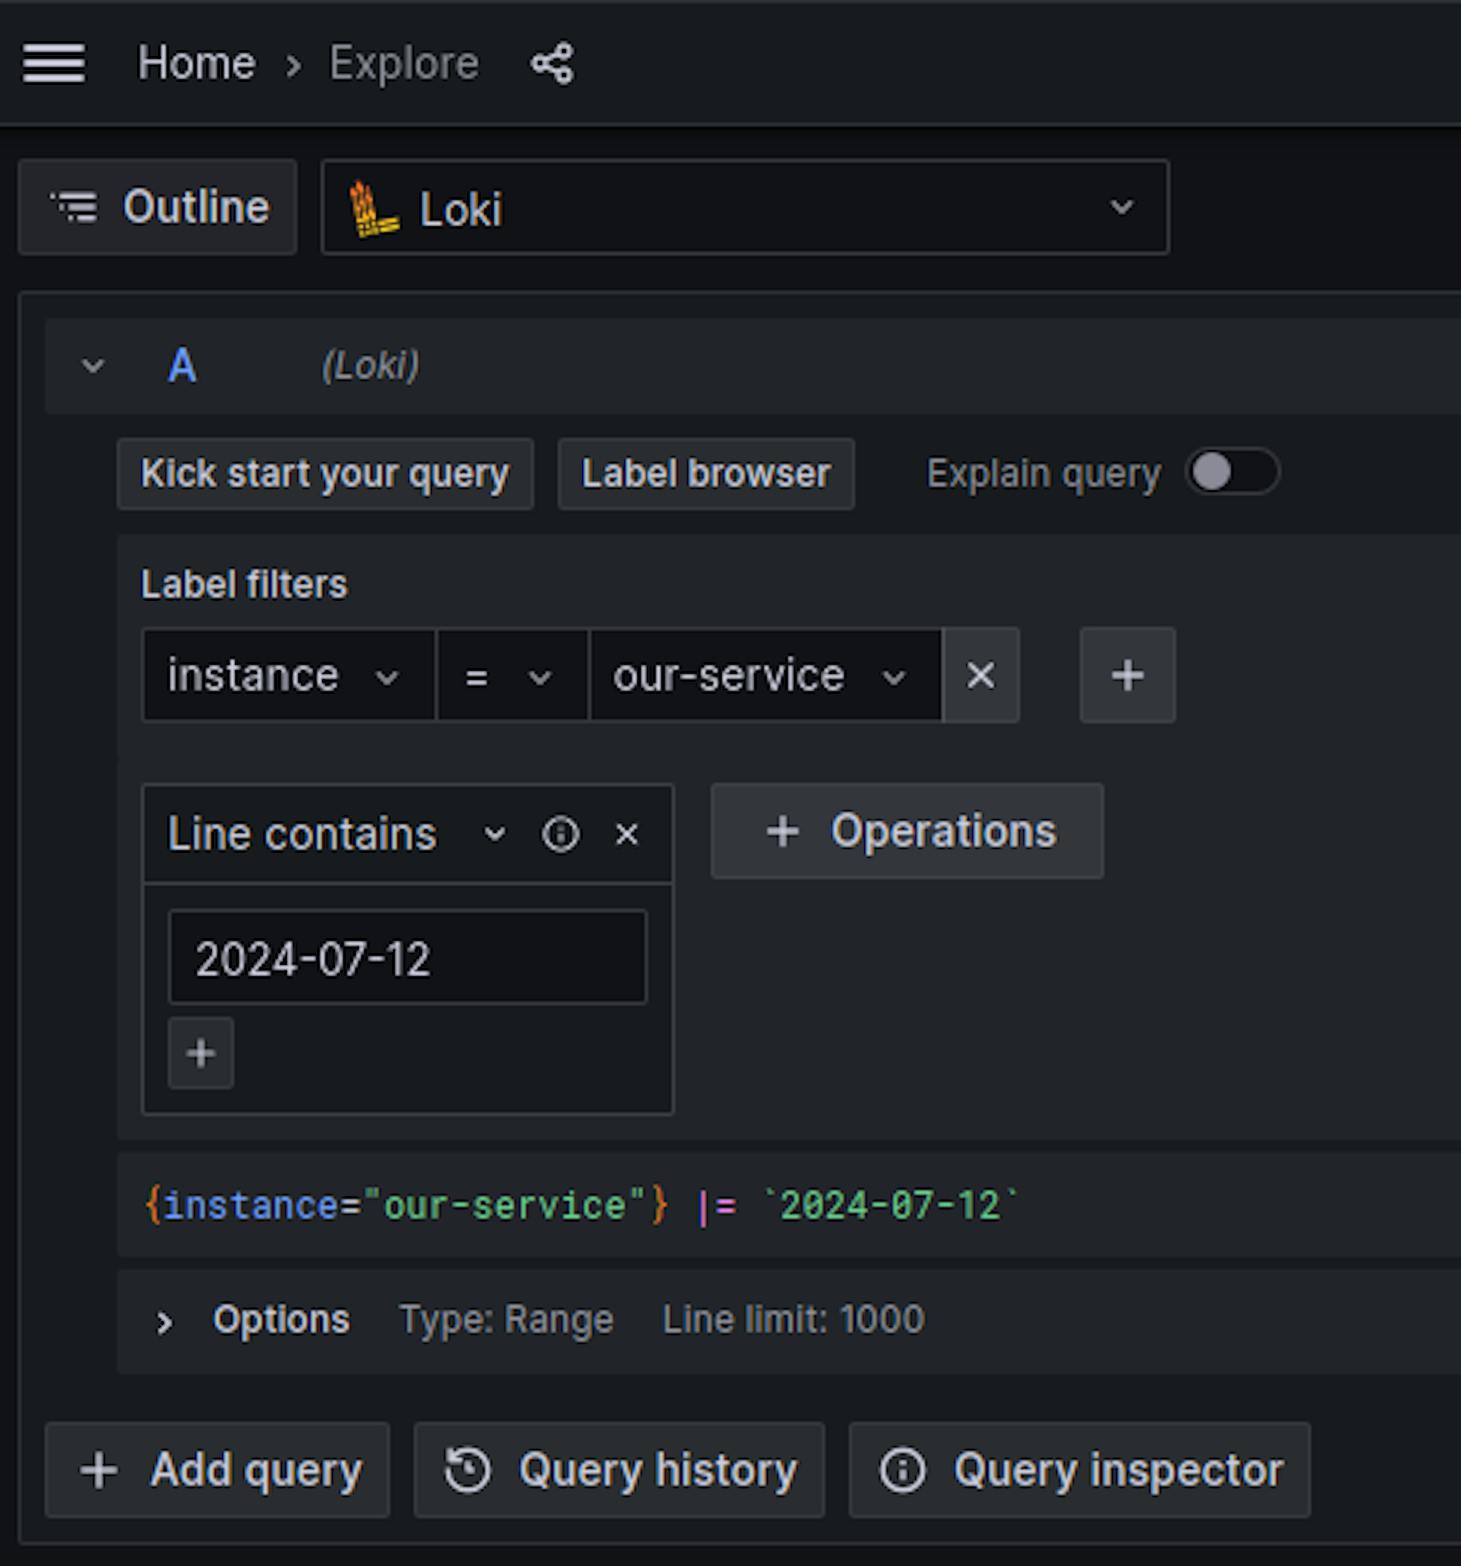
Example query:
{instance="our-service"} |= `2024-07-12`Execution
1. Install LogCli:
LogCLI is the official CLI tool for Grafana Loki. It lets you run LogQL queries directly against a Loki instance and download logs to a local file without any line limit.
You can download the LogCli binary from the Loki releases page
2. Set Loki Address:
Configure the Loki address for LogCli using an environment variable:
export LOKI_ADDR=http://localhost:80003. Connect LogCLI to Loki running in Kubernetes:
Forward local ports to the Loki pod to allow local access:
kubectl --namespace loki port-forward svc/loki-stack 8000:31004. Extract logs:
Use LogCli to query and save the logs to a file:
logcli query '{instance="our-service"} |= `2024-07-12`' --limit=5000000 --since=72h -o raw > our-service-2024-07-12.logIn this command:
--limitis set with a high value to ensure all logs are captured.--sinceis set to 72 hours to cover a sufficient time range.
For large time ranges or high-volume streams, add --parallel-duration=1h --parallel-max-workers=4 to parallelise fetching and avoid hitting query timeouts.
Conclusion
The whole process took approximately 10 minutes and resulted in a file containing the complete application logs for the specified date. If required, this process can be further optimised or automated.